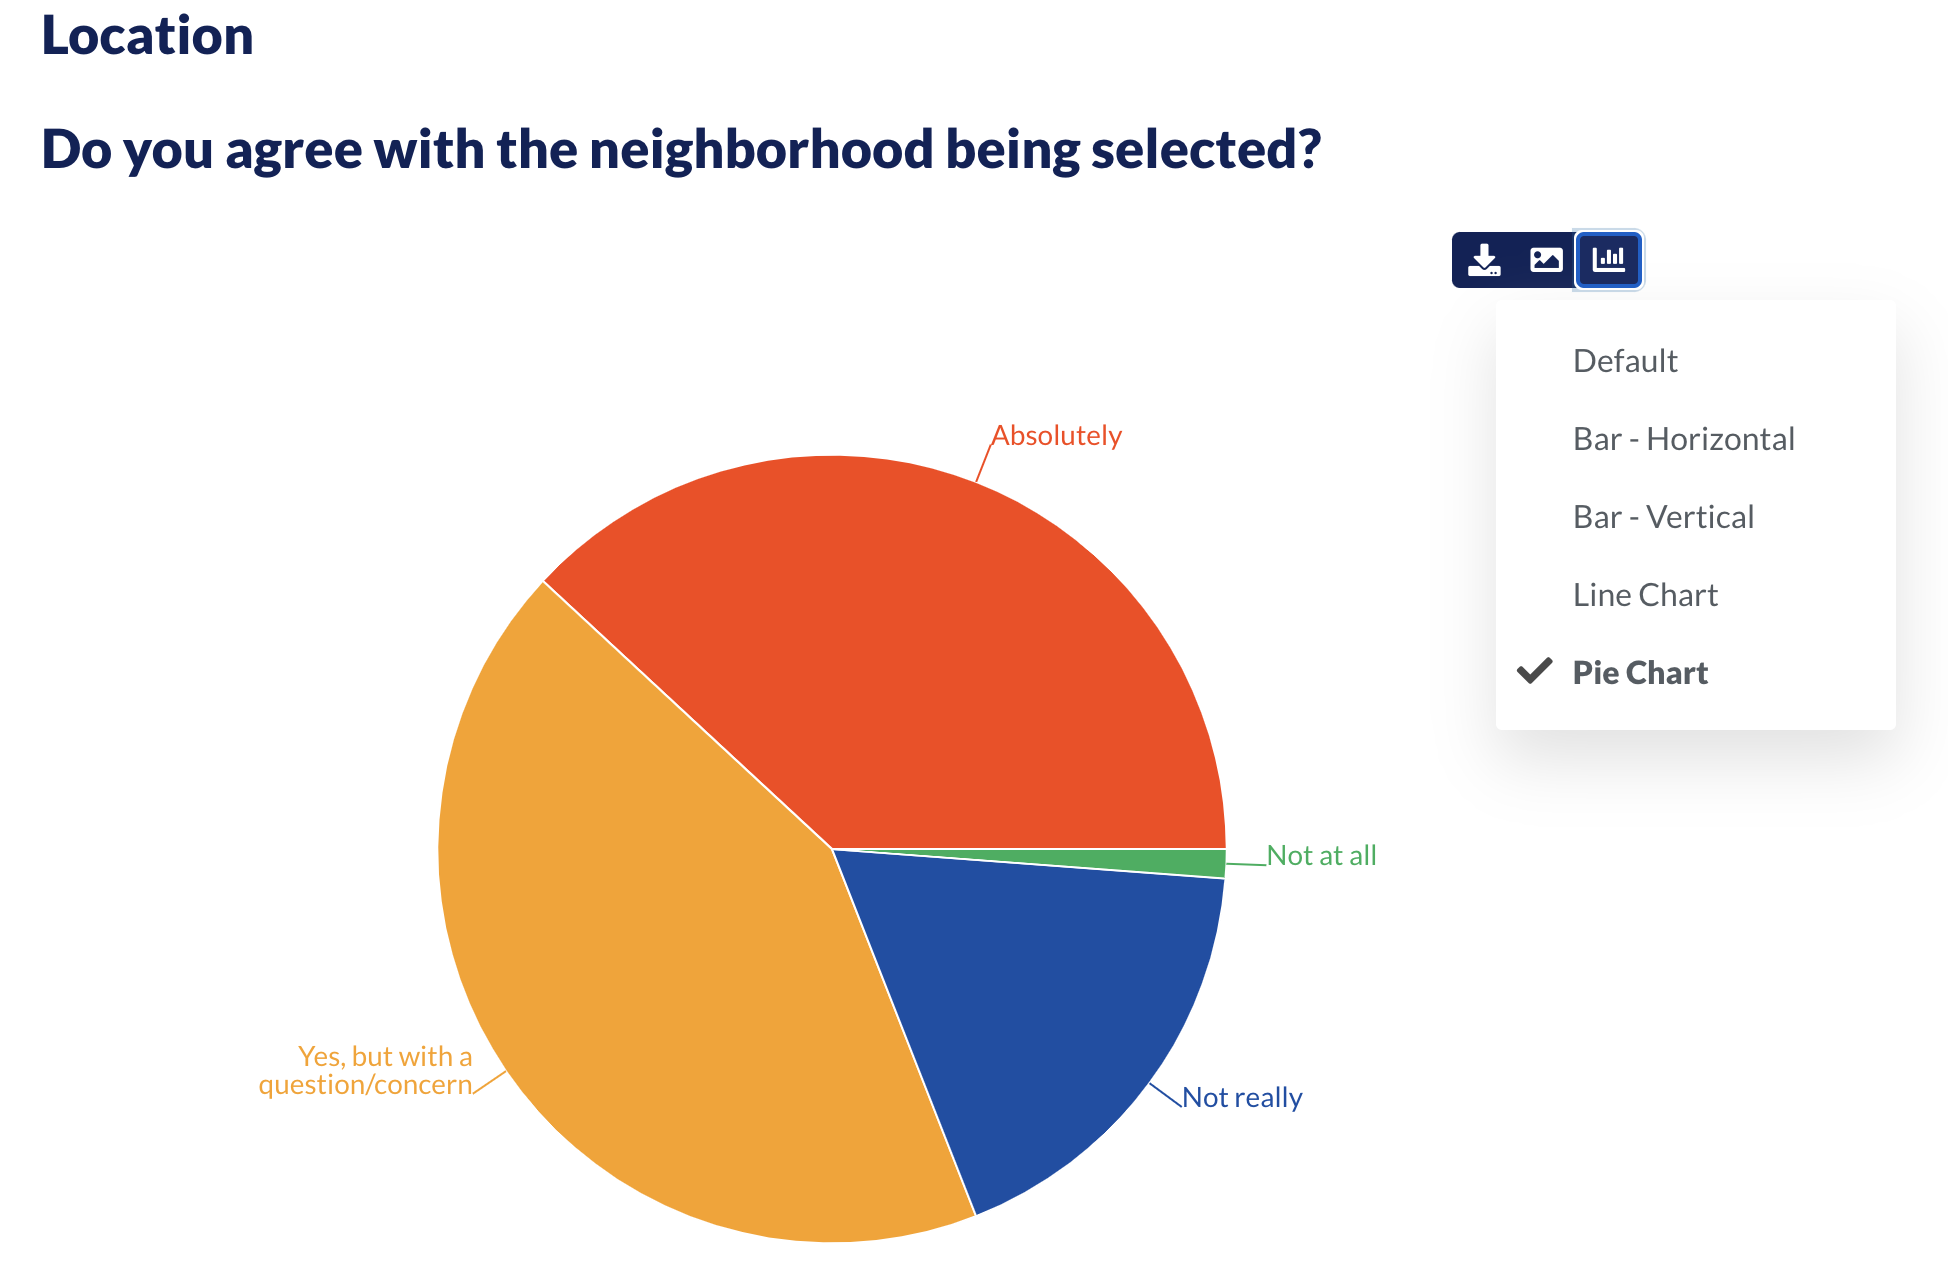
*Your published report will display your default chart style. If you would like a different chart style for your published report you can change the visualization of a chart in the results and analysis area
-
Ensure you are logged in to Zencity Engage.
-
Navigate to your project page and select the project that you
want to view the results of an engagement on, click on the
‘Engagement’ tab and then select your required engagement.
-
Navigate to the ‘Results & Analysis’ tab.
-
On the left hand side of the page, under the ‘Pages’ heading,
select the page that has the chart that you want to view.
-
On the top right hand side of the chart, click on the blue
chart icon and select your preferred visualization style. If you
choose to download the image, it will download in your chosen
style.

Comments
0 comments
Article is closed for comments.